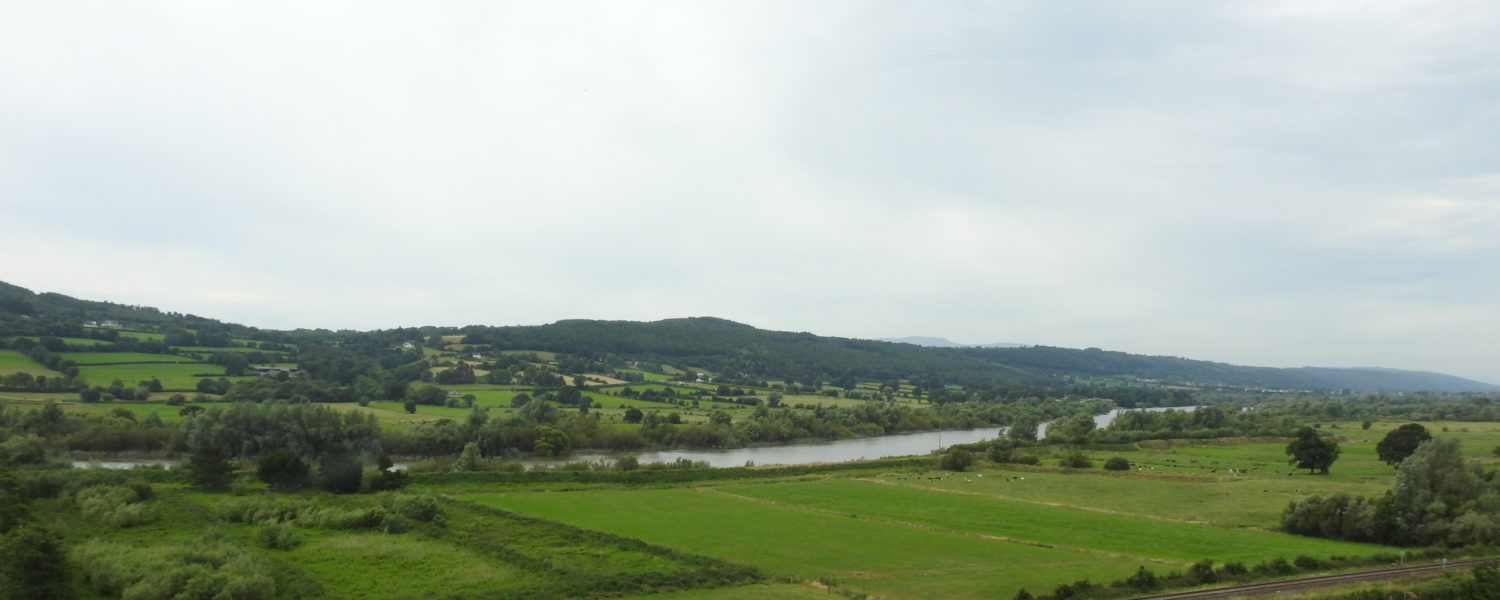
Since it’s lockdown2 in 2020, I’ll try to do the #30daymapchallenge. I have decided to focus on Achill Island, because some of the challenges have to do with water and one with islands, so I can check these boxes already. I’ve never been there, but I have seen satellite imagery en gros.
Day 3/ Tag 3
Day 4/ Tag 4
Day 5/ Tag 5
Day 6/ Tag 6
Day 7/ Tag 7
Day 8/ Tag 8
Day 9/ Tag 9
Day 10/ Tag 10
Day 11/ Tag 11
Day 12/ Tag 12
Day 13/ Tag 13
Day 14/ Tag 14
Day 16/ Tag 16
Day 17/ Tag 17
Day 22/ Tag 22
Day 23/ Tag 23
Day 24/ Tag 24
Day 25/ Tag 25
Day 26/ Tag 26
Day 27/ Tag 27
Day 28/ Tag 28
Day 29/ Tag 29
Day 30/ Tag 30
Day 1/ Tag 1
#26 map with new tool/ kartografiere mit einem neuen Werkzeug
As part of my effort to collect fieldnames in Ireland, I was given names in Fingal by a former resident. The area is now developed into a golf course and housing estates, so the usual mapping with OpenStreetMap was not possible. I used geojson instead. Read more (external link)…
Als Teil meiner Bemühungen Feldnamen zu sammeln, hatte ich von einer ehemaligen Bewohnerin von Fingal dortige Namen erhalten. Das Gebiet ist inzwischen als Golfplatz und Wohngebiet entwickelt, sodass das übliche Kartografieren mit OpenStreetMap nicht möglich war. Ich habe stattdessen geojson verwendet.
Day 3/ Tag 3
#2 “lines” and #3 “polygons”
Deserted Village on Achill Island/ Wüstes Dorf auf Achill Island
The map shows the deserted village Southwest of Doogort on Achill Island. The walls of the houses and the ones used as field boundaries are built as drystone walls. According to Wikipedia, it has been deserted since Famine times. However, since the practise of “boleying” was common on Achill decades after that, the deserted houses were still used in the summer months. Boleying is the practise of bringing cattle (and I guess other grazing animals) to a different, more fertile pasture ground during the summer. “Boley” is also sometimes part of a fieldname or even a townland, referring to this practise (check out logainm.ie). I had mapped the walls and ruins previously and used overpass-turbo to extract ruins=building and wall=dry_stone.
Achill Island ist eine Insel im Westen Irlands, auf der der deutsche Schriftsteller Heinrich Böll jahrelang lebte. Im Norden der Insel gibt es ein verlassenes Dorf mit ca. 80 Häusern (Ruinen) und zahlreichen Mauerresten. Sowohl die Häuser als auch die Mauern sind in Trockenbauweise, d.h. ohne Mörtel gebaut. Obwohl das Dorf seit der Hungersnot 1846 nicht mehr bewohnt ist, wurde es Jahrzehnte später noch als “Boley”-Dorf genutzt. “Boleying” ist wie die Almwirtschaft eine saisonale Form der Viehhaltung. Junge Menschen aus dem nahegelegenen Doogort wohnten in den Sommermonaten in den verfallenen Häusern, während sie die Tiere hüteten.
Die Karte zeigt in grau die Trockenmauern (barrier=wall, wall=dry_stone) und in braun die Überreste der Häuser (ruins=building).
Sources/Quellen:
- Wikipedia on Achill (English/ Deutsch) (includes images of ruins/ englische Version enthält Bilder der Ruinen)
Day 4/ Tag 4
#5 blue/ #5 blau
Nothing too fancy today, just coloured in the water and waterways.
Nichts allzu Aufregendes heute, nur die Wasserflächen und Wasserläufe sind eingefärbt.
Day 5/ Tag 5
#red/ #rot
Today, I’ve added houses to the map (building=house). This was only possible, because we as OpenStreetMap Ireland recently finished mapping all the buildings in West Mayo. November last year, we started mapping all buildings on the island that is Ireland using a task manager to keep us going. If I remember correctly, we have finished the counties of Kilkenny, Carlow and Waterford. This November, we are focussing on towns and finished Newry and Thurles yesterday. The first task for every tile in the task manager is to add all buildings with at least the tagging building=yes. After that, a validator comes along and makes sure that all the buildings are mapped and might be more specific in retagging as building=house, building=school, building=farm_auxiliary or whatever they can make out from the satellite imagery. So when I validated on Achill Island, I tried to improve the building tagging.
Heute habe ich Häuser zur Karte hinzugefügt, die in OpenStreetMap als building=house gekennzeichnet werden. Das war nur möglich, weil wir als OpenStreetMap Ireland kürzlich das Kartografieren aller Gebäude in West Mayo abgeschlossen haben. Im November letzten Jahres hatten wir begonnen, alle Gebäude auf der Insel Ireland (also Nord~ und die Republik) zu kartografieren. Dafür nutzen wir einen “Taskmanager“, um effektiv zu arbeiten und uns zu motivieren. Wenn ich mich recht erinnere, haben wir die Grafschaften Kilkenny, Carlow und Waterford abgeschlossen. Diesen November konzentrieren wir uns auf Städte und haben gestern Newry (Nordirland) und Thurles (Tipperary) abgeschlossen. Die erste Aufgabe für jede Kachel im Taskmanager ist, alle Gebäude mit mindestens der Kennzeichnung building=yes zu versehen. Danach schaut ein Prüfer (validator) über die Kachel und schaut, ob wirklich alle Gebäude erfasst sind. Außerdem kann er/ sie die Gebäude genauer als Haus (building=house) oder Schulgebäude (building=school) oder Farmgebäude (building=farm_auxiliary) etc kennzeichnen, je nachdem, was man vom Satellitenbild erkennen kann. Als ich einer der Prüfer für Achill war, habe ich versucht, die Kennzeichnung für Gebäude zu verbessern.
Day 6/ Tag 6
#7 “green”/ “grün”
Again, nothing too exciting: For today, I only added sports pitches (leisure=pitch) to the Achill map.
I have to say, it is quite a challenge to add anything interesting using data, because the data is so hard to come by. Maybe focussing on Achill wasn’t such a good idea.
Wieder nichts zu Aufregendes: Für heute habe ich nur Sportplätze/ Hurlingfelder (leisure=pitch) hinzugefügt.
Es ist eine ziemliche Herausfordung, interessante Daten hinzuzufuegen, wenn es so schwierig ist, an Daten zu kommen. Vielleicht war es ein Fehler, dass ich mich auf Achill konzentieren wollte.
Day 7/ Tag 7
#8: yellow/ gelb
Today, I’ve added schools (building=school) on Achill Island. There aren’t many…But maybe they’re not all mapped, although churches, GAA pitches and schools are usually mapped before houses. It needs a bif of local knowledge though, even though they can usually be recognised by the basketball pitches nearby.
Heute habe ich Schulen auf Achill (building=school) hinzugefügt. Es gibt nicht viele…Aber vielleicht sind noch nicht alle kartografiert, obwohl Kirchen GAA Sportplätze und Schulen normalerweise vor Häusern verzeichnet werden. Man braucht ein bisschen lokales Wissen, obwohl man Schulen auf dem Satellitenbild oft auch an den Basketballfeldern in der Nähe erkennen kann.
Day 8/ Tag 8
#11 3D (Might take a while to load, be patient, it’s worth it…)
Something a bit more exciting today, I hope. Buildings in 3D. I have prepared that earlier, in that I used Mapillary imagery (very limited on Achill, please add more, if you’re close by), to add no. of building levels (building:levels=*), roof shape (roof:shape=*) and in some cases colour of the building (building:color) to OpenStreetMap. Now you can see how it is displayed: The house rendering magic by MapBox which only seems to read the height tag, so the buildings are all rendered the same height, because I had no possibility to measure the height in meters and nobody else has added it to OSM either. It might be able to do more, please excuse the ignorance, I will look into it.
Next up, we have f4map, which renders an estimate of the building height by the number of building levels, which really mostly works for houses. I think it automatically renders sheds and garages lower, provided they’re defined as that on OSM, of course. But you can see that apart from building features, it also renders fences, walls, hedges, power poles, trees and flagpoles (all of which you can define the height and colour of, as far as I’m aware). There is also a terrain feature, because THE EARTH IS NOT FLAT! 😉
And thirdly, we have osmbuildings.org, which focusses on buildings, as the name suggests already. So no fences, walls, flagpoles or trees. And no terrain, as far as I know. I only discovered 3D mapping during Heritage Week this year, when we were mapping Clonmel. Have a look there, if you like: f4map & osmbuildings.
Kurz gefasst: Auf OpenStreetMap kann man Gebäude und andere Elemente mit 3D-Eigenschaften versehen. Ich habe das für die Strecke zwischen Dooniver und Doogort auf Achill vor ca. zwei Wochen getan. Die drei Beispiele zeigen, wie drei verschiedene Anbieter mit der Information umgehen. MapBox zeigt nur die Höhe der Gebäude an, die ich aber nicht in Metern definieren konnte, sondern nur in Anzahl der Etagen, F4map zeigt sehr viele Details bis hin zu Straß,;nlaternen, Mauern und Fahnenmasten, osmbuildings zeigt nur Gebäude in 3D. F4map zeigt auch die Schatten aufgrund der Sonneneinstrahlung zur aktuellen Tageszeit. Auf der Startseite von f4map und osmbuildings wird jeweils Berlin angezeigt, wer da mal schauen möchte, was theoretisch möglich ist…
Day 9/ Tag 9
#12 “map made without GIS software”
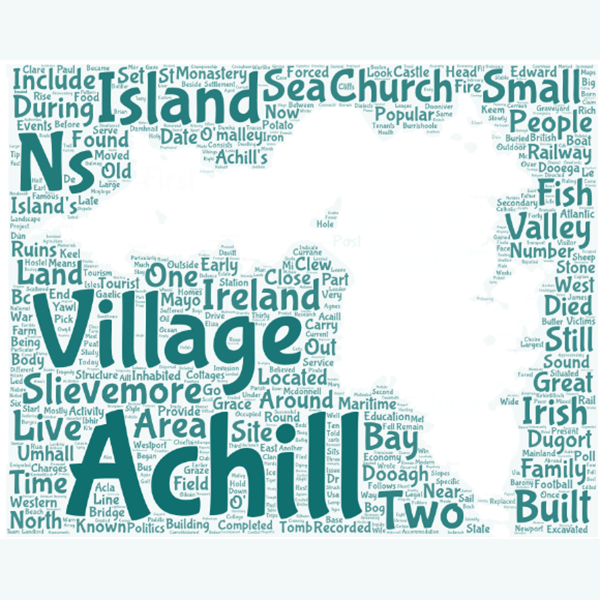
So I used the text on the Wikipedia page for Achill Island and fed them into Wordart to generate the Wordle. Luckily, it is quite a long article, so the result is quite interesting, I think.
Also, hier habe ich die Wörter aus dem englischen Wikipedia-Artikel für Achill Island genommen und auf der Wordart Webseite eingefügt mit dem Achill-Hintergrundbild. Der Wikipedia-Artikel ist yum Glück recht lang, so dass das Ergebnis recht repräsentativ ist, denke ich.
Day 10/ Tag 10
#4 hexagons
A couple of days ago, an archaeologist friend had suggested that I map all the remaining railway turntables as one of my challenges. I looked into it and obviously, I couldn’t map them, because these are daily challenges and there’s not enough time for a task like that. Luckily, most of them seem to have been mapped already by OSM user VictorIE. If you don’t know what they are: They are like lazy Susans for locomotives, so the (steam) locomotives are driven unto them and then the whole platform turns (usually by 90° or 180°). They’re only needed for heritage trains nowadays, because modern locomotives have drivers’ cabins on either ends. (Sorry if I’m using wrong vocabulary, I’m not a train enthusiast.) Anyway, I decided to also add the sorry excuse of the Irish Railway system to show that some of the remaining turntables are in the middle of nowhere, because the tracks have been removed.
Some of the turntables are mapped on archaeology.ie, but because this data is collected county by county and they have different criteria of what to map, it is not quite a comprehensive database. Also, there is no possiblity to search for “turntable” on it.
Vor ein paar Tagen hat ein befreundeter Archäologe vorgeschlagen, dass ich die noch erhaltenen Eisenbahn-Drehscheiben in Irland als eine der Herausforderungen umsetze. Ich habe mir das angeschaut und natürlich konnte ich sie nicht selbst verzeichnen, weil diese Herausforderungen täglich sind und das nicht genügend Zeit lässt. Zum Glück hat aber der OSM Nutzer VictorIE die meisten bereits eingetragen. Heutzutage werden sie nur noch für Museumslokomotiven genutzt, weil moderne Loks Führerkabinen an jedem Ende haben. Jedenfalls habe ich beschlossen, die Peinlichkeit des irischen Eisenbahnnetzes ebenfalls darzustellen, so dass ich zeigen konnte, dass einige der Drehscheiben heute inmitten der Pampa sind, weil die Eisenbahnschienen entfernt worden sind.
Einige der Drehscheiben sind auf der Regierungsseite archaeology.ie verzeichnet, aber da diese Daten jeweils für jede Grafschaft gesammelt werden und jede Grafschaft seine eigenen Prioritäten hat, was gesammelt wird, ist es nicht wirklich eine umfassende Datenbank. Außerdem kann man dort auch nicht nach “turntable” suchen.
Day 11/ Tag 11
# 9 “monochrome”

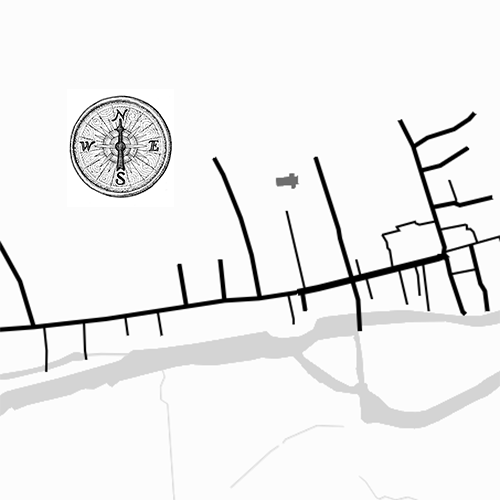
Maps of the medieval streets of Kilkenny, Clonmel and New Ross with its main/ High streets as the thickest line and the small lanes as the thinnest. The church is the respective St. Mary’s Church, the rivers are all flowing from left to right.
I did not research this thoroughly, there might be lanes missing (there certainly are between Kieran St and the river Nore in Kilkenny), but I was using a modern map as the base.
Karten der mittelalterlichen Straßen von Kilkenny, Clonmel (Tipperary) und New Ross (Wexford) mit der Hauptstraße als dickste und den Gassen als dünnste Linien. Die Kirche ist jeweils die Marienkirche, normalerweise eine normannische Gründung. Die Flüsse fließen alle von links nach rechts. Ich habe das nicht sehr gründlich recherchiert, da können also durchaus Gassen fehlen (definitiv zwischen Kieran Street und der Nore in Kilkenny, aber ich habe moderne Karten als Basis genutzt und da sind die alle ein großer Parkplatz).
Day 12/ Tag 12
# 17 “historical map”
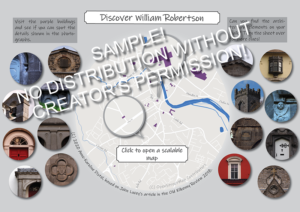

This one took me a few days, choosing sites, taking pictures, layouting etc. It’s a treasure hunt map to discover the Kilkenny born architect William Robertson using 16 examples of his work in Kilkenny – there is more in Kilkenny and beyond. It is based on the article by John Lucey in the Old Kilkenny Review 2018.
Das hat ein paar Tage in Anspruch genommen, weil ich Beispiele auswählen, Fotos machen, Layout entwerfen etc musste. Es ist eine Schnitzeljagd-Karte auf den Spuren des in Kilkenny geborenen Architekten William Robertson mithilfe von 16 Beispielen in Kilkenny – es gibt weitaus mehr in Kilkenny und darüber hinaus. Die Basis war der Artikel von John Lucey im Old Kilkenny Review 2018.
Day 13/ Tag 13
Challenge 27 “big or small data” – Mapping Can Save Lives
Today’s map shows “all one defibrillators” as well as all 10 life rings mapped on OpenStreetMap for Achill Island. According to several newspaper articles, there should be more defibrillators on the island. I have actually called one of the GP’s offices a couple of days ago, to be more precise the one GP who is supposedly (according to one of those newspaper articles) responsible for the AED program, but “she does not work [here] any more”. I was told my message would be forwarded, but I doubt it will happen.
So, about 2,500 people live on Achill, I would presume a high average age, and the number can double during tourist season. If I take all the newspaper articles, there should be about five defibrillators on the island. I wouldn’t want to be a foreign tourist having a heart attack.
So please, people, when you’re on your 5km exercise walk anywhere in Ireland or worldwide and you spot a defibrillator, add that node to OpenStreetMap using emergency=defibrillator. It could save someone’s life. Once the data is out there, it would be easy enough to have an app showing the next AED.
- Defibrillator at St. Fionnan’s Nursing Unit on Achill Sound (Irish Times, 2001)
- Defibrillator at Achill GAA Club (2013)
- there was another one about defibrillators being given to three GPs on the island, but I can’t find it again
Day 14/ Tag 14
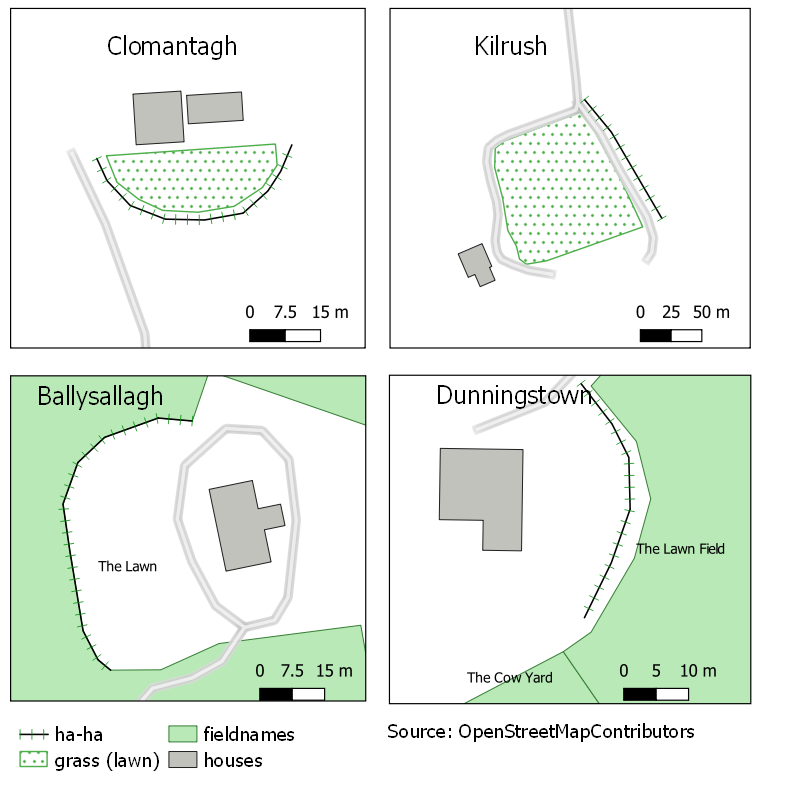
Challenge 18 “landuse”
Something a bit different today. I got about 42 fieldnames from a neighbour two days ago and decided to use them for making a tutorial about how the British War Office map from 1940 can be utilised for mapping. It is especially helpful for bulldozed hedges and ditches and certain placenames. There were some interesting names in the collection, so I got carried away a bit and the video turned out longer than intended. The most important bits are between minute 3 and 20, I think.
Day 16
Challenge 19 “NULL”

I’m not a computer expert, but NULL means “zero data”, right? So I looked for creches on Achill Island for another challenge and couldn’t find any online. So there we go.
Ich bin ja kein Computer-Experte, aber NULL heißt “keine Daten”, oder? Ich hatte nach Kindergärten auf Achill gesucht und keine gefunden. Also voila.
Day 17/ Tag 17
Challenge 15 “Connections”
While mapping Achill Island a couple of weeks back, I discovered that one of Grainne’s castles (Grace O’Malley) was there. And I remembered I had been on a bridge in Carlow, Leighhlinbridge, to be precise that she is supposed to have crossed on her way to London. (Why a pirate queen would take the landroute via Leighlinbridge, I don’t understand at all…) So, there’s your connection from Achill Island to Leighlinbridge to London and some more castles with connections to her.
Day 22/ Tag 22
I’m a few days behind, because I got distracted with other things and also had no ideas for the challenges or lacked the know-how. But I downloaded QGIS (Wiki link) two days ago and made a start with it. It is overwhelming, because all my GIS skills are self-taught and there are just so many options on QGIS! But one of my mapper friends helped me get started, so there is the result for
challenge 10 “grid” and challenge 21 “water”

It is a 5km x 5km grid which is just a random number. Obviously, elevation plays a role with ringforts (Wiki link) as well, but that’s for another challenge.
Day 23
Challenge 22: “movement”
Placenames like Twomileborris and Ninemilehouse intrigue me. I believe they have something to do with the coach service and the necessity to change horses. Back in the day when Charles Bianconi was running his coach service.
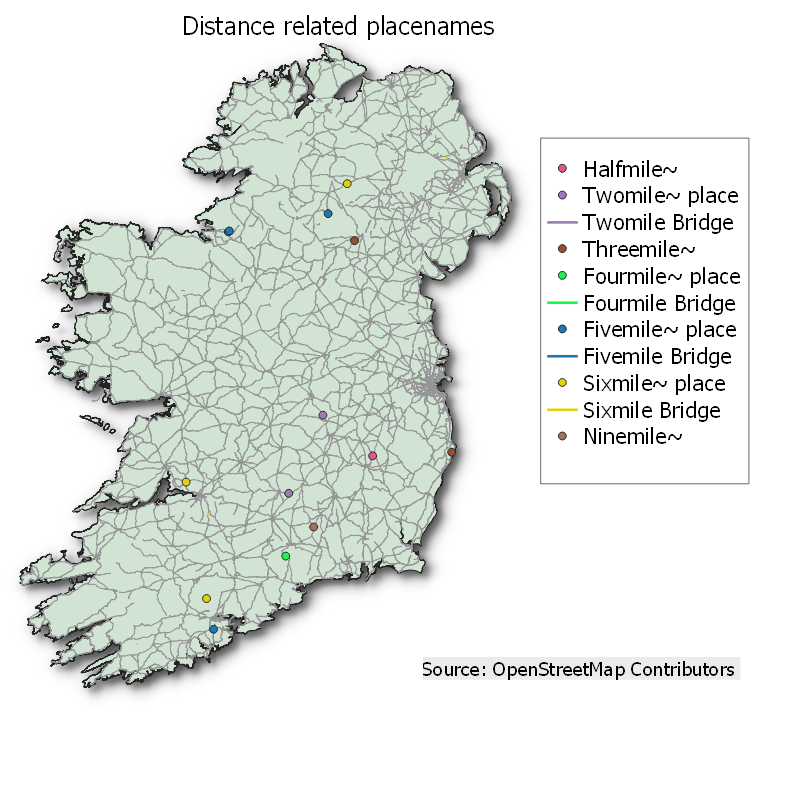
So I have tried to extract placenames from OpenStreetMap which have distances in them. There are probably more, but they might not be mapped or I didn’t know how to look for them. But it’s a start.
Day 24
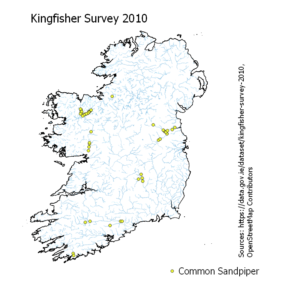
Challenge 20 “population”
Another day with QGIS, this time trying to work with OpenSource data from the Irish government – the Kingfisher Survey.
Strandläufer

Schwanzmeise

Schilfrohrsänger

Eisvogel
It had a lot more types of birds, I just chose the first four alphabetically (they had the names in Latin). I had to split it into four maps, because the dots were all on top of each other, because I think the counting went on along rivers.
Day 25
Challenge 23: Boundaries
Day 26
Challenge 16 “island” and 28 “non-geographical map”

Day 27
Challenge 25: Covid19
I thought about this one for a long time. But I had seen mask littering and I thought it might be a good idea to draw more attention to it. The dashed line was my survey route, I actually added quite a few waste baskets to OpenStreetMap along that route. The shops are colour coded by what type of mask they sell: Green only sell reusable ones, orange only disposable ones and yellow both types.
Day 28
Challenge 14 “climate change”
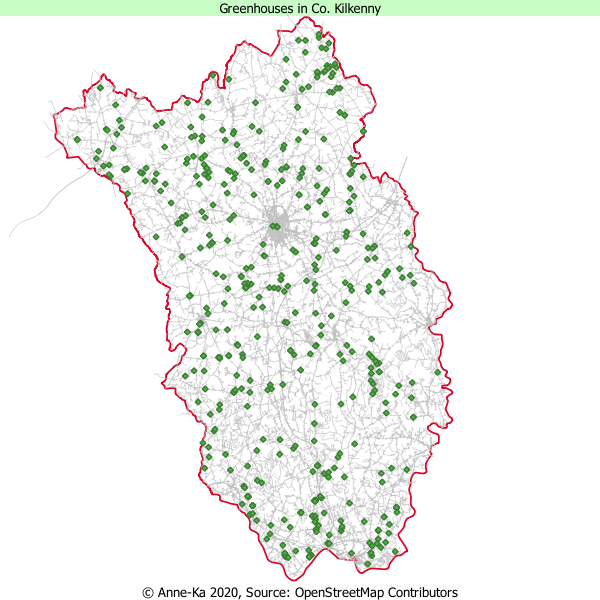
I make a point of mapping every polytunnel I can see on satellite view, even though they are not as permanent structures as other buildings. Just as an explanation: This is about reducing the carbon footprint by growing your own food and especially food that has to be imported from far away.
Day 29
Challenge 13 “raster”, 24 “elevation” and 14 “climate change” (again)


A friend had suggested I try to do this and I meant to do it yesterday, but I didn’t know how to. I figured it out today, so there we are. As regards climate change, with an increase in storms and rain, erosion will play a part in reducing the land mass as well. That was certainly the most challenging challenge, but great fun.
Day 30
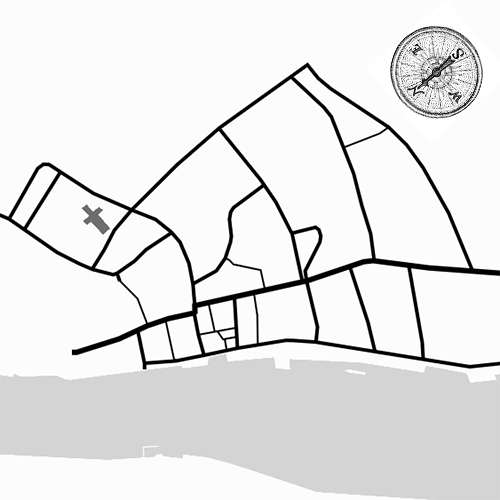
Challenge 30 “a map”
Two days ago, I had gotten more fieldnames, this time from the townland of Newgrove around Dysertmore House. So I tried to make an oldfashioned looking map using QGIS, and also new to me – InkScape.

I really don’t like the North arrow, but the choice of them in QGIS is not great. I’ll have to make my own.
That’s the challenge over. I think I learned quite a bit.